Warning: Undefined array key "end_date" in /home/users/kjakub01/public_html/domains/laser-beam-profile.com/public_html/wp-content/plugins/beaf-before-and-after-gallery/inc/class-promo-notice.php on line 39

Warning: Undefined array key "end_date" in /home/users/kjakub01/public_html/domains/laser-beam-profile.com/public_html/wp-content/plugins/beaf-before-and-after-gallery/inc/class-promo-notice.php on line 46
Huaris Profiling software for laser beam profilers

Over 10 years we help companies reach their financial and branding goals. Engitech is a values-driven technology agency dedicated.

Gallery

Contacts

411 University St, Seattle, USA

engitech@oceanthemes.net

+1 -800-456-478-23

Dedicated laser beam profiler software

Precision in every beam: laser beam profiling made easy with our Huaris Profiling software.

Huaris Profiling software is a powerful tool designed for the easy and precise characterization of laser beams. With our software, you can effortlessly measure and analyze the key parameters of your laser beam, including beam width, divergence, power, and beam profile. Our software is user-friendly and intuitive, making it easy for anyone to use, even those without extensive experience in laser diagnostics.

Effortlessly optimize your laser performance with our dedicated profiling software.
Our software is equipped with advanced algorithms that ensure precise measurements and reliable results, giving you the confidence you need in your laser system’s performance. The intuitive interface allows you to customize your measurement settings, analyze your data, and generate detailed reports to help you make informed decisions about your laser’s performance.

With Huaris Profiling software, you can achieve a level of precision and accuracy in laser beam profiling that was previously difficult to achieve. Our software is designed to meet the needs of a wide range of industries and applications, from scientific research to industrial manufacturing. Whether you’re looking to optimize your laser performance or ensure consistent quality control, Huaris Profiling software has the tools you need to succeed.

// Laser Beam profiler desktop software

Dedicated software for laser beam analysis

Transform the way you work with lasers with our powerful profiling software at your fingertips.

Local software directly supporting the profilometer or other measuring devices dedicated to industrial systems. This software comes in two variants: desktop for Windows computers (for Huaris One, Five, etc.) or mobile for tablets in the mobile versions of our products (Huaris One Mobi, Huaris Five Mobi, etc.)

Distribution
Main
Settings
Setup
Measurement
Stability
Tools
Calibration
Help

Distribution

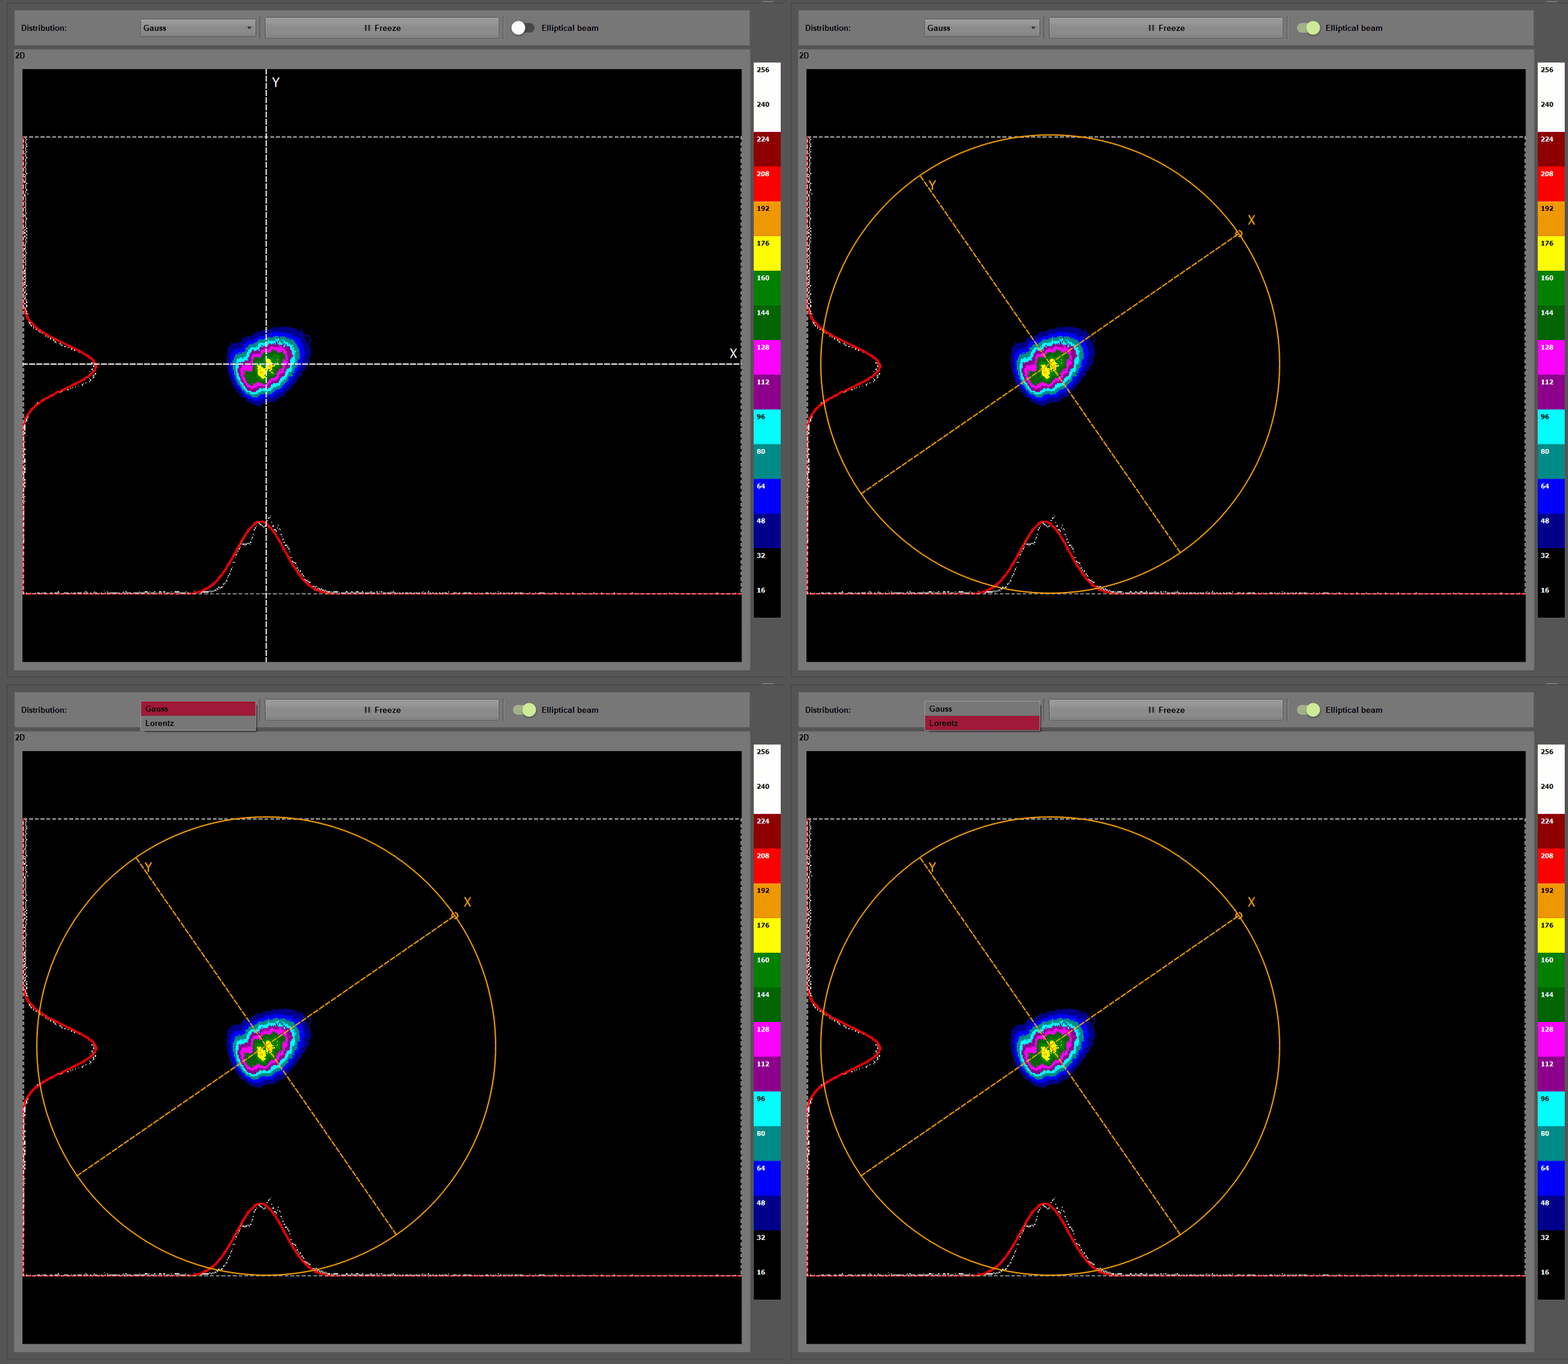
The local software facilitates measurement of Gaussian and Lorentz beams. If you expect to measure a specific distribution you can select the kind of your beam using "Distribution" combo box. The Huaris software will calculate the beam width and the distribution parameters specific either to Gaussian or Lorentz.

In this view you can also selection option to measure elliptical beams. If you do so the ellipticity parameter will be displayed in the "Measurement" tab. If you measure the elliptical beam the coordinate system may automatically rotate and its color is changed to orange.

For all measurements the width and statistical moments are calculated along two mutually perpendicular axes: X and Y. The axes are displayed in real-time in the 2D view. The origin of the XY coordinate system is calculated in the center of the beam and the position of the coordinate system follows the beam center position. All is done automatically.

At any moment the measurement can be paused, or frozen, by clicking "Freeze" button. You can resume life measurement mode by clicking it again.

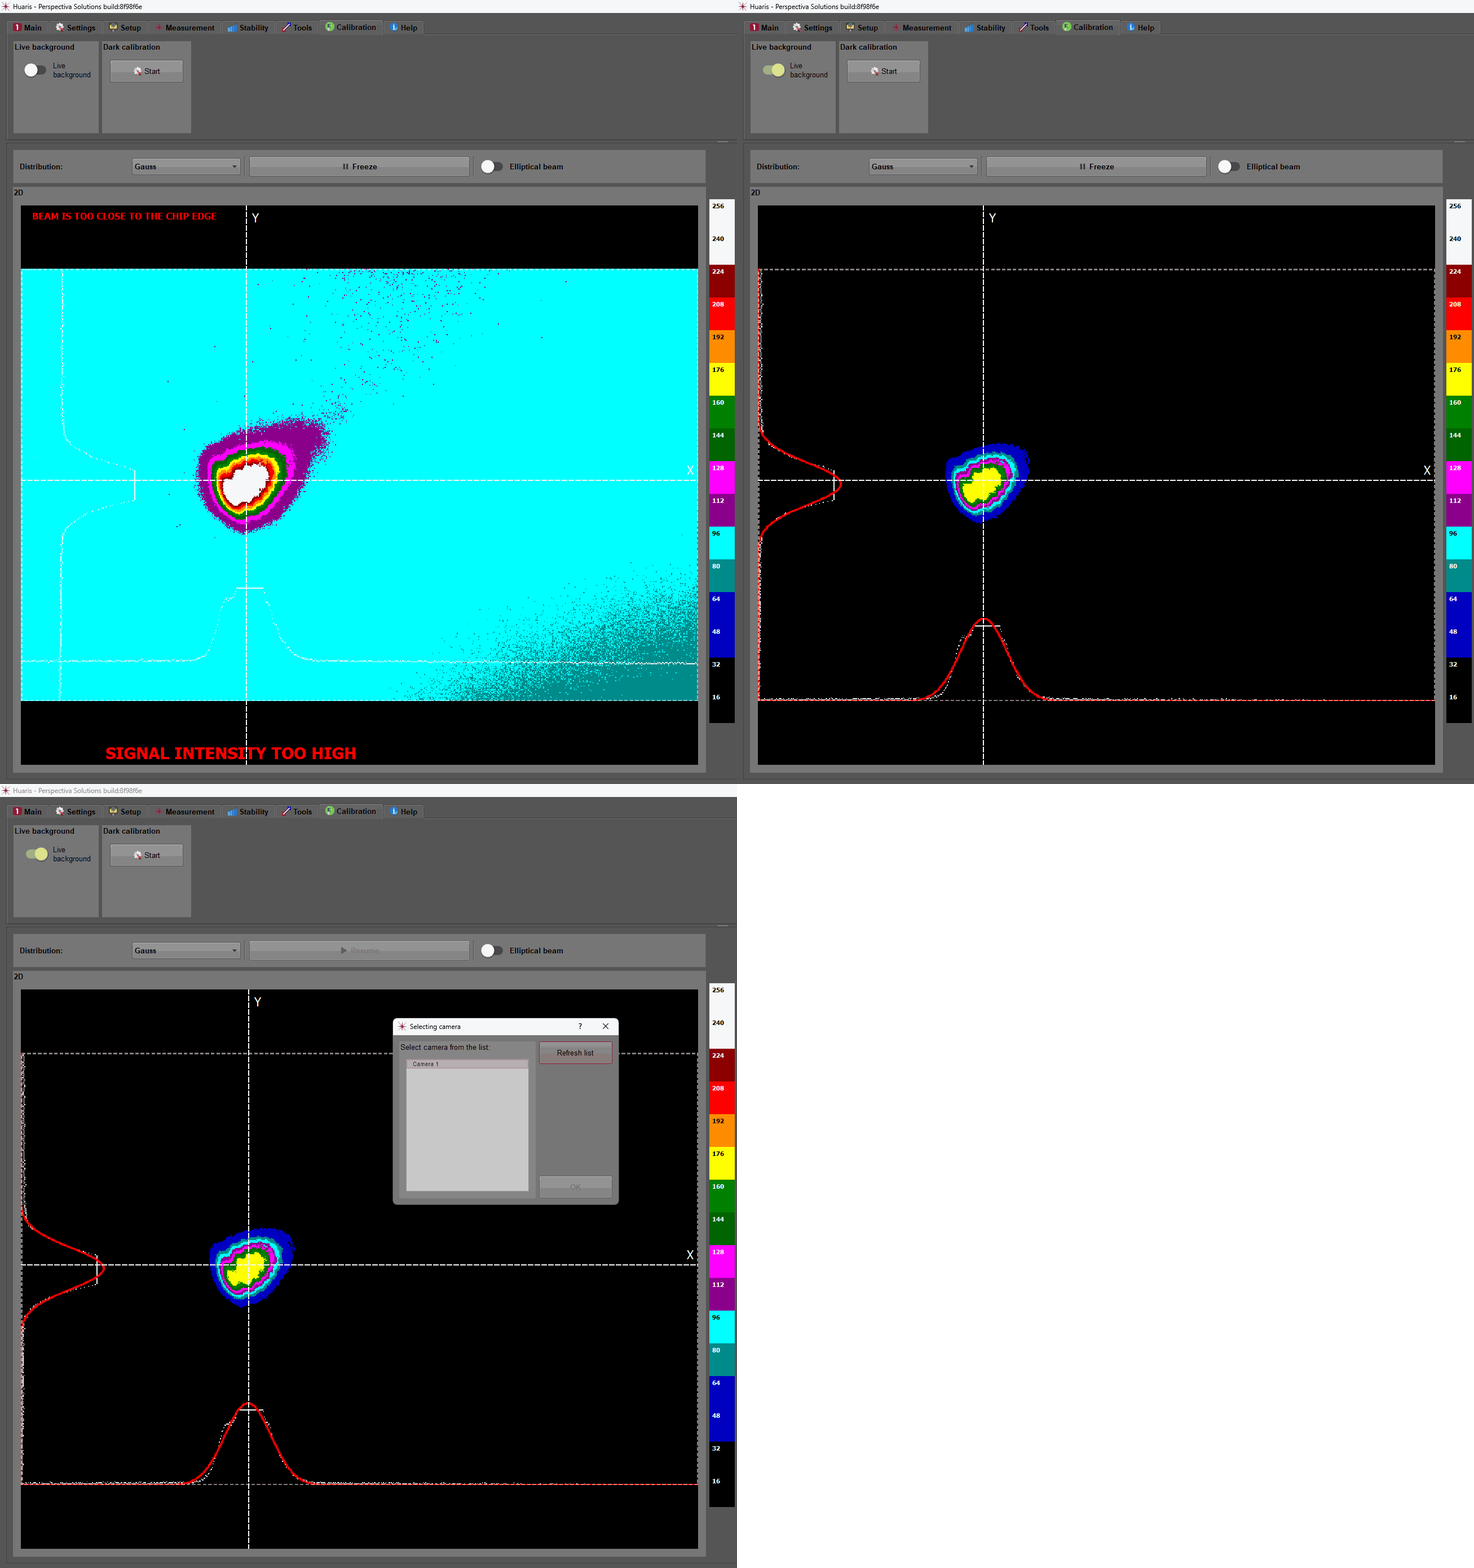
If your beam intensity is too strong, too weak or too close to the detector array edge the relevant pop-up messages will be displayed in the 2D view.

2D view shows also the white spots on horizontal and vertical edge which represent the real measurement points along X and Y axis, respectively. The white spotted rectangle in the 2D view shows real size of the detector array.

The red lines show curves calculated in the fitting operation.

The beam intensity is mapped according to the colors scale shown on the right side of the 2D view.

Huaris laser beam profiler software with function of distribution lorentz gauss elliptical beam
Huaris Laser Beam Profiling Software Tutorial: Menu 2D | 3D view

This tutorial comes from our YouTube channel (https://www.youtube.com/@LaserDiagnostics) and aims to provide valuable information and practical demonstrations on various topics related to our products and services.

Main

In the main menu, the program allows you to export data from the analyzed laser beam. For the application, the function of generating a non-editable report and saving it in PDF format is available.
2D view: For a 2D view, you can save data in a text file and in graphic files (BMP, JPG, PNG) in both regular and raw.
3D view: For a 3D view, you can save data in a graphic file (BMP, JPG, PNG).
2D and 3D video preview loading functions are also available. You can record a video from 2D and 3D views. It can be in grey scale or in color - depending on the selection you made in the "Settings" tab where you can switch the coloring of the beam on and off.

Huaris laser beam profiling software menu can generate report to pdf format
Huaris Laser Beam Profiling Software Tutorial: Main menu functions

This tutorial comes from our YouTube channel (https://www.youtube.com/@LaserDiagnostics) and aims to provide valuable information and practical demonstrations on various topics related to our products and services.

Settings

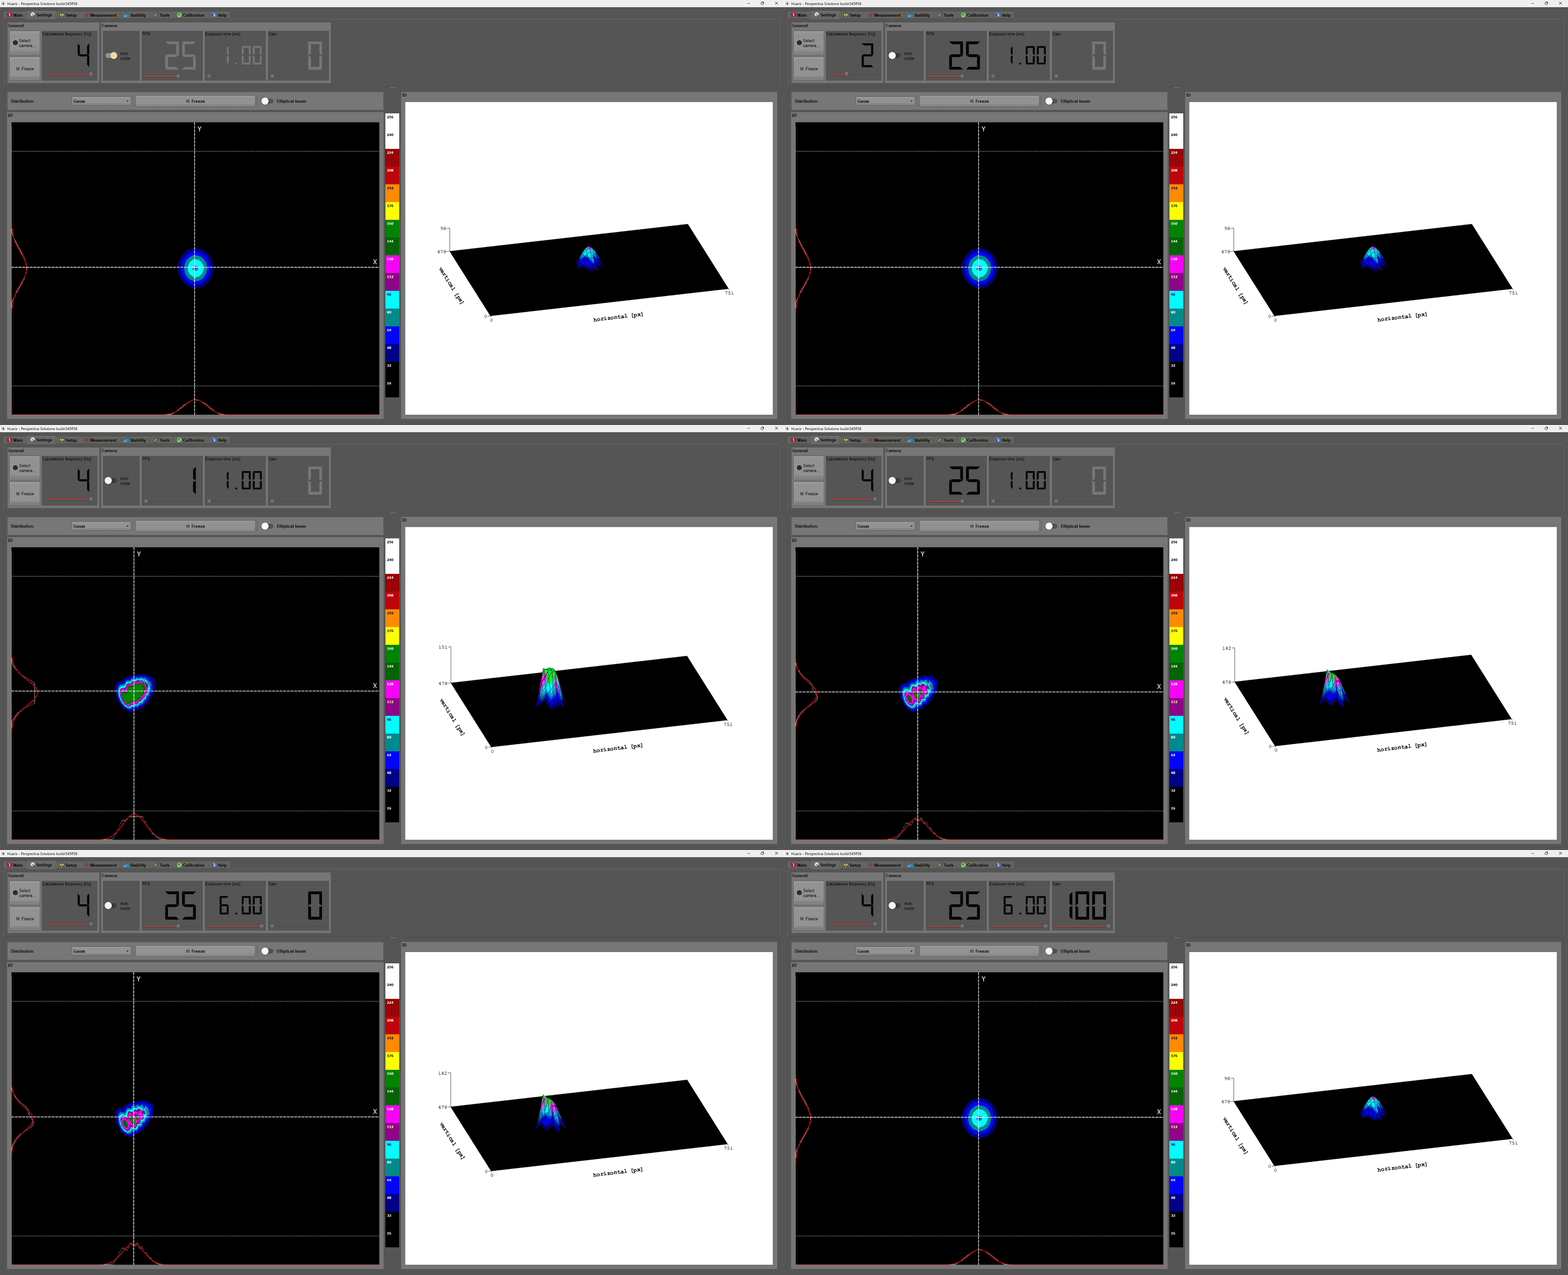
The "Settings" menu tab is used to change the basic program adjustments. The local application can work with one profiler at a time but a few of them can be connected simultaneously to the same computer and you can easily switch between them. You can select here an available device. In this tab you can also select calculations frequency (from1 to 4 [Hz]) and change the camera measurement mode from auto to manual. The manual option activates additional settings for adjusting camera parameters such as: frames per second - FPS, exposure time and gain. If you select the software to work in auto mode the exposition parameters (FPS, exposition time, gain) will be adjusted fully automatically and they will be tuned according to the changes of the beam intensity. Also, fully automatically.

Huaris Laser Beam Profiling Software Tutorial: Settings FPS | Gain | Exposition Time

This tutorial comes from our YouTube channel (https://www.youtube.com/@LaserDiagnostics) and aims to provide valuable information and practical demonstrations on various topics related to our products and services.

Setup

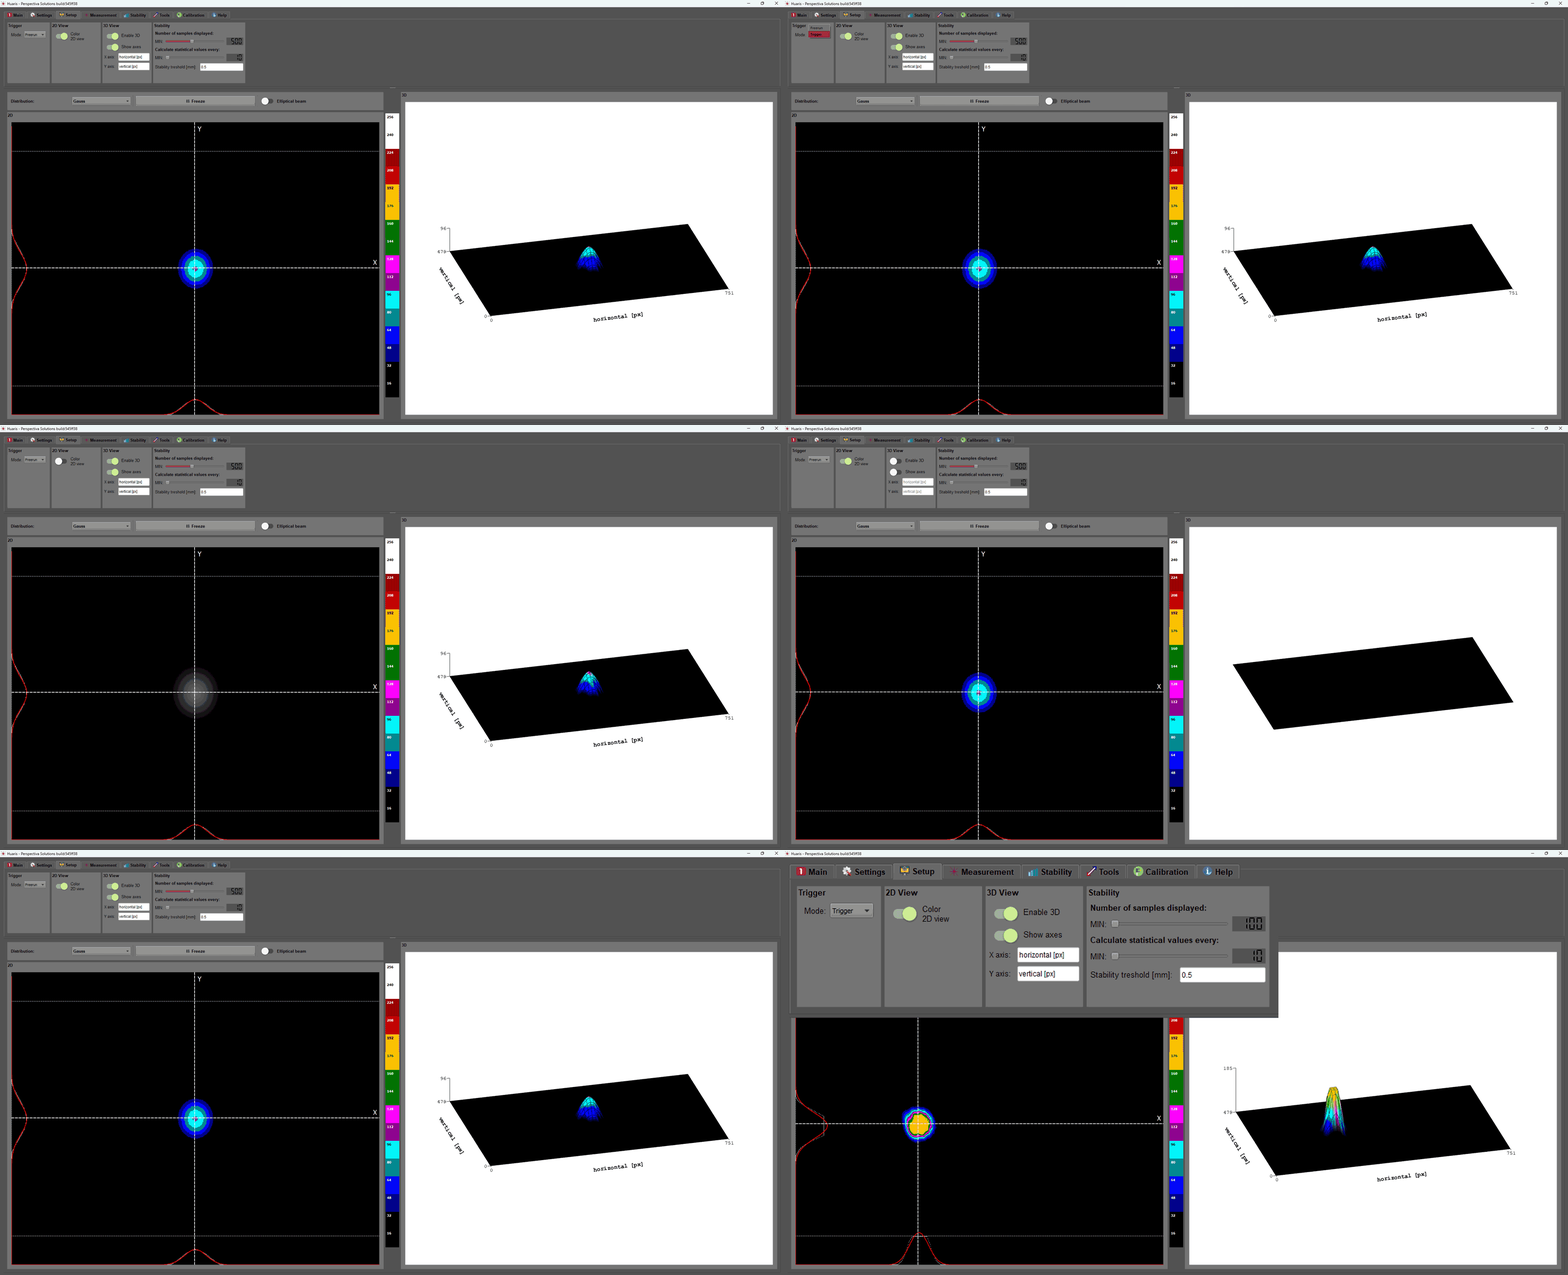
In addition to these options, there is also a trigger mode adjustment (freerun or hardware trigger). This option allows you to synchronize the measurement with the moment when the laser pulse arrives at the detector.

In this menu, we also set the 2D coloring view, turn on the display of the 3D view, and the X and Y axes. Changing the labels in the 3D view is also possible.

The settings menu also allows you to modify the way the parameters of the beam pointing stability is calculated and displayed. You can change the number of points which are used to calculate statistical parameters of the beam center position. Additionally, you can change the number of points displayed in the charts in the "Stability" tab.

In this tab you can set a threshold which will trigger the alarm that your beam pointing stability is exceeding the limit. This is applicable only if you are using Huaris Laser Cloud. If the limit is exceeded immediate alarm is set and the Cloud will send you immediate notification according to the preferences defined in the Cloud (via e-mail, SMS, or in the web application).

Huaris Laser Beam Profiling Software Tutorial: Settings FPS | Gain | Exposition Time

This tutorial comes from our YouTube channel (https://www.youtube.com/@LaserDiagnostics) and aims to provide valuable information and practical demonstrations on various topics related to our products and services.

Measurement

The measurement results of the beam width are presented in the three tables. The first table shows the parameters of the laser beam width according to the selected type of the beam distribution. e.g. For the Gaussian distribution it is FWHM, 1/e2, 1/e, 4σ . If you choose Lorentz or elliptical beam the names of the parameters and their values will change. The physical units are presented in the caption of each table.

The second table shows the raw parameters of the laser beam distribution.

The third table shows the statistical moments (for Gaussian distribution).

Important note: if your laser beam is too strong, too weak or too close to the chip edge the "Measurement" tab will present no values. It is just because making a measurement on the invalid beam makes no physical sense. In such a case the 2D view will present relevant notification in red, bold letters.

Huaris Laser Beam Profiling Software Tutorial: Analyzing Laser Beam Width Measurements

This tutorial comes from our YouTube channel (https://www.youtube.com/@LaserDiagnostics) and aims to provide valuable information and practical demonstrations on various topics related to our products and services.

Stability

The "Stability" tab presents the measurement of the beam pointing fluctuations in space. Namely, we present here a few graphs which essentially give you the information on how the beam travels on the detector array.

The primary values that we observe here are coordinates of the center of your beam. The most left part with caption "Beam location" gives you coordinates of the current position of the center of your beam.

The scatter plot draws in the real time the red dots in the places where the center of your beam was found. This graph is to present visually how much your beam travels in the detector chip.

The coordinates of the center of the beam are monitored in the real time using two types of coordinate systems: Cartesian (XY Chart) and polar (Polar chart). We do that for both coordinates: X and Y in case of the Cartesian, and angle and vector modulus for the polar system. Each coordinate is drawn in different color. This allows you to quickly see what is the nature of your beam instability.

For each coordinate we calculate statistical parameters: the average and the standard deviation (for Cartesian and for polar). Their most recent numeric values are also displayed in the bottom left corner of the view.

The number of samples to be taken into calculation of statistical parameters and the number of measurement points of the coordinates rendered in the XY Chart and Polar chart can be modified in the "Settings" tab according to the user preference.

Huaris laser beam profiling Software Tutorial: Exploring laser beam pointing Stability

This tutorial comes from our YouTube channel (https://www.youtube.com/@LaserDiagnostics) and aims to provide valuable information and practical demonstrations on various topics related to our products and services.

Tools

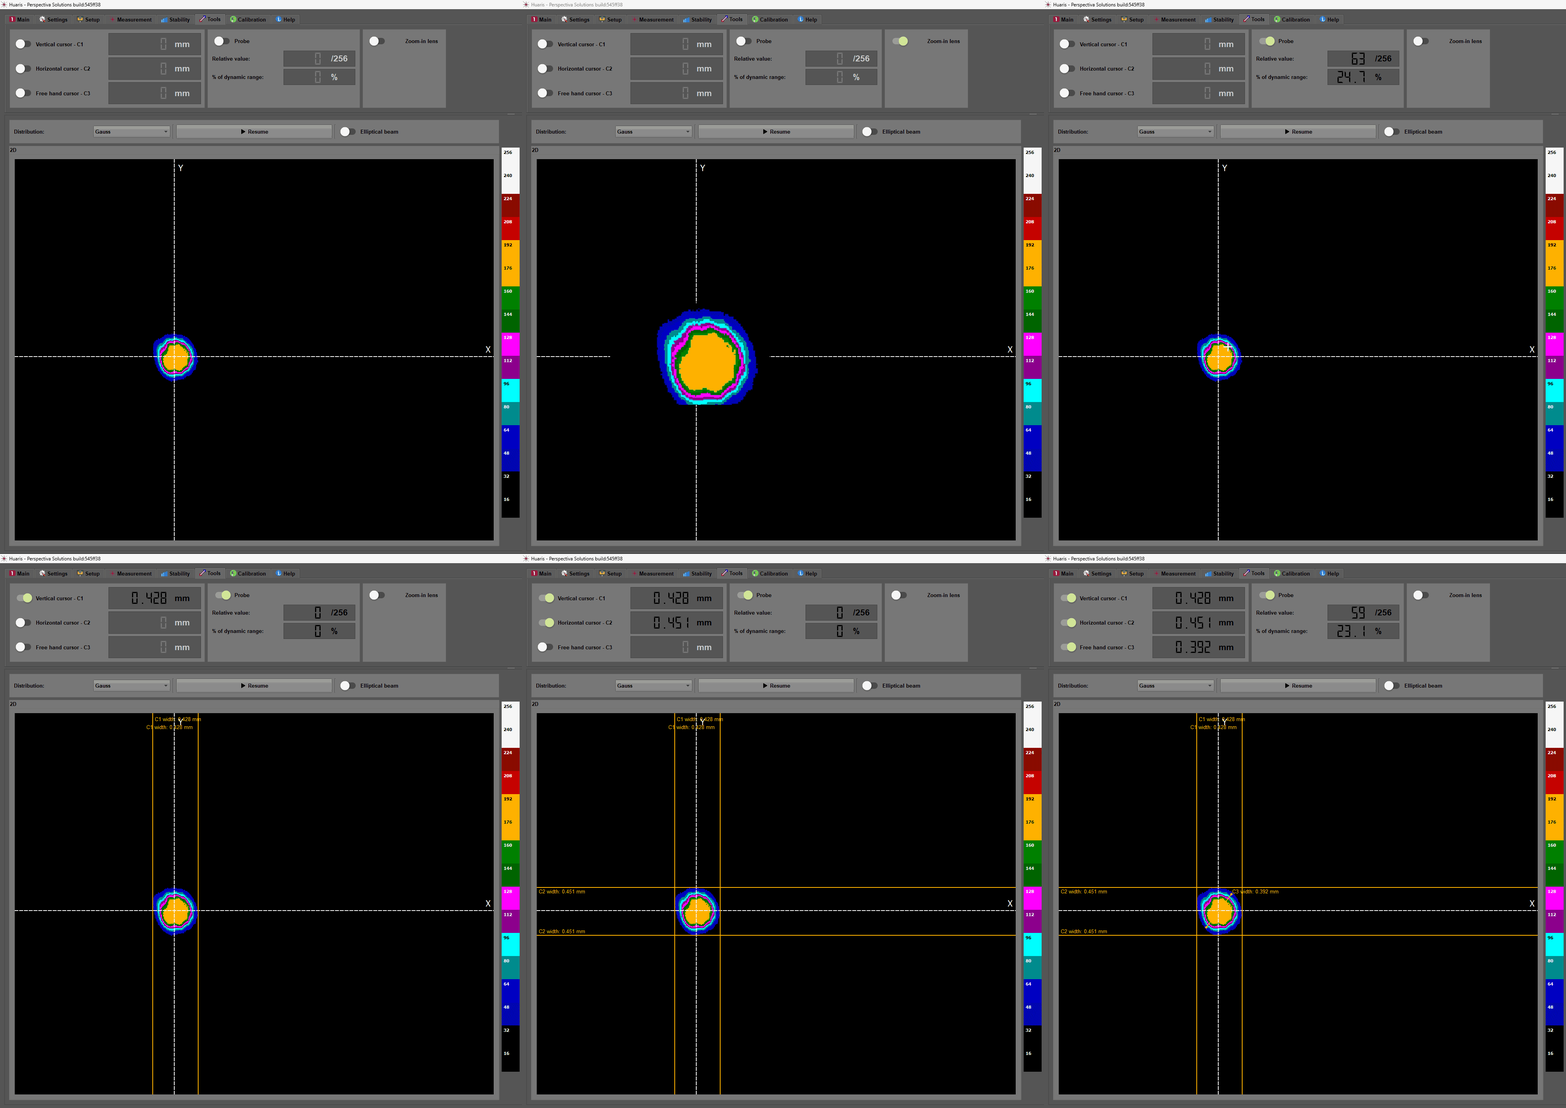
The tools menu provides useful tools for manual measurements the laser beam. The first group of tools are cursors. There are three of them: vertical (C1), horizontal (C2) and free-hand (C3). Each cursor can be activated individually.

The second tool inspired by our clients is the Probe. The Probe is essentially a tool to check the relative intensity of the laser beam in the spot you click in the 2D view. The value is given in the relative counts and as a percentage of the total dynamic range of the detector.

The zoom-in lens is a tool that allows you to locally magnify the beam to the maximum resolution given by the detector. This tool allows to observe all the fine details and speckles in the laser beam.

Huaris laser beam profiling Software Tutorial: Tools for laser beam characterization

This tutorial comes from our YouTube channel (https://www.youtube.com/@LaserDiagnostics) and aims to provide valuable information and practical demonstrations on various topics related to our products and services.

Calibration

The calibration tab is a place where we take care of noise. The noise may originate from the detector itself (e.g. natural thermal noise) or from the ambient lightning which might impact the measurement accuracy in a severe manner. For this reason we have put a lot of effort to develop our own advanced algorithms. One of them we named DNC - dynamic noise correction. This algorithm is implemented in the Life background option. It scans the change of the ambient lighting conditions and implements additional real-time correction in the profile measurement. Due to this method HUARIS is a robust tool for any conditions measurements.

Dark calibration is another method increasing the measurement accuracy. The goal of the dark calibration is to compensate for imperfections that every single detector has. E.g. not every pixel as exactly same quantum efficiency or some of them might even go dead. Such artefacts might heavily impact the measurement precision. For this reason we have implemented a method that allows our software "to learn" the detector and it will compensate all its imperfections. Dark calibration is conducted only once in our products when you run the device for the first time on a specific computer. In case of Mobi products we do that procedure at production time for you to allow you to focus on your daily work. Such approach was pursued to also make our devices work-ready. You just need to plug it and "play". Compared to our competitors who often require to conduct the calibration every time you start the measurement. It's all ready out of the box and we save lots of your valuable time.

Another important aspect is calibration of the measurement results. This option is embedded in the software and it allows us to offer you the ultimate measurement accuracy.

Huaris laser beam profiler quality software with dark calibration and live background
Huaris laser beam profiling Software Tutorial: Calibration | Live background mode

This tutorial comes from our YouTube channel (https://www.youtube.com/@LaserDiagnostics) and aims to provide valuable information and practical demonstrations on various topics related to our products and services.

Help

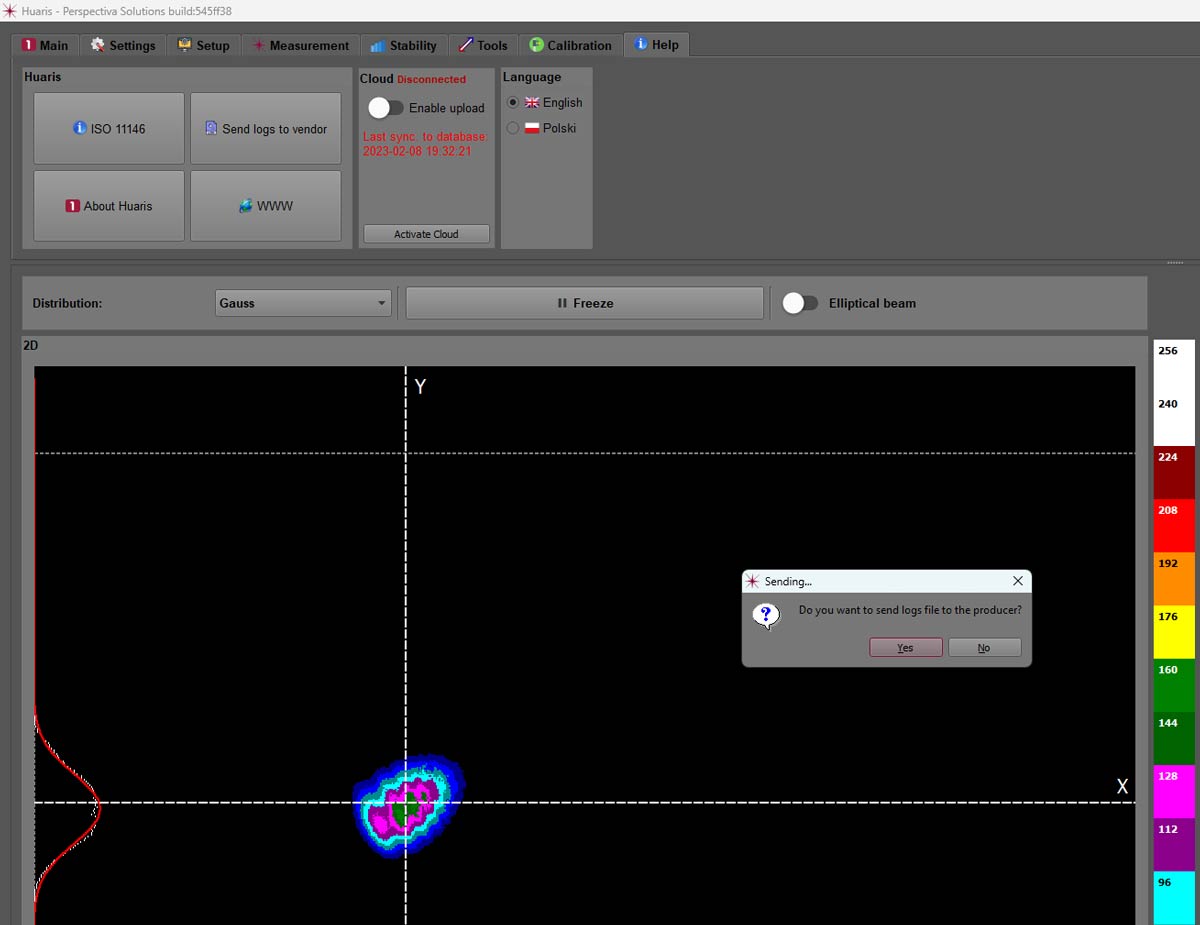
This tab provides information about the ISO standards we comply with in our measurements methodology. It also gives the information about the product and the producer. It also allows to quickly get to the product page where all the parameters and functionalities can be verified.

A very important button is "Send logs to vendor". This button in only one click collects the information about your measurement device, software, operating system and sends us an email with all that diagnostic information to allow us to give you a quick support in case something does not work well. Please, us it only when you need some direct assistance.

Finally, the Cloud section facilitates cooperation between your local application and the Huaris Cloud - an advanced web system, backed by the artificial intelligence that highly extends functionalities of our products. Click here to learn more about the Huaris Lasers Cloud. The button "Activate Cloud" allows you to input the license key for the web application. For our laser beam profilers we offer 3 months of the free license as a testing period. Later, they are available in the subscription model. This section allows you also to check the status of your connection with the Cloud. If it is displayed in green it means your data is sent to the Cloud at specific intervals (normally every 1 min). Otherwise the labels will be shown in red and information that you are "Disconnected" is amended.

Using the Cloud is not compulsory. You can disable upload of the data to the Huaris Lasers Cloud by clicking "Enable upload" option. However, the Cloud gives so many useful functionalities that we strongly encourage to use it. Lear more about the Huaris Cloud here.

You can also change and switch the software language in this menu between English and Polish (as we are Polish company 😊 ). The use of more languages is possible in the web application (HUARIS CLOUD) where we allow now about 20 different languages.

Huaris laser beam profiler desktop help menu application with activate cloud and send logs function
Huaris laser beam profiling Software Tutorial: Calibration | Live background mode

This tutorial comes from our YouTube channel (https://www.youtube.com/@LaserDiagnostics) and aims to provide valuable information and practical demonstrations on various topics related to our products and services.

Webinar of Huaris System
- Innovation Award Shortlist Quantum category + Sensors

Presentation of the Huris system by Perspectiva Solutions, the subject :

“Artificial intelligence in predictive maintenance of the laser systems”

The webinar presenters were the finalists of the Innovation Award of Laser World of Photonics event in Munich this year in the metrology category.

Perspectiva Solutions representatives had show how do we address the problem of long downtimes and automatic, remote monitoring of laser systems using artificial intelligence.

// Drop us a line! We are here to answer your questions 24/7

NEED A CONSULTATION?

Contact Us

We would be grateful for your feedback about the product. Also, if you would like to receive quotation for our product, please use the contact form below.

Our Office in Poland

Perspectiva Solutions
Młyńska 27 St.
22-400 Zamość, Poland

We work on working days CET (Central European Standard Time) in the following hours:

Md. – Fr. 8:00 – 16:00
Sat. – Sun. – Closed

Free Consultation

Huaris inquiries:
Phone inquiries:

Our distributors

    Query for Huaris system: